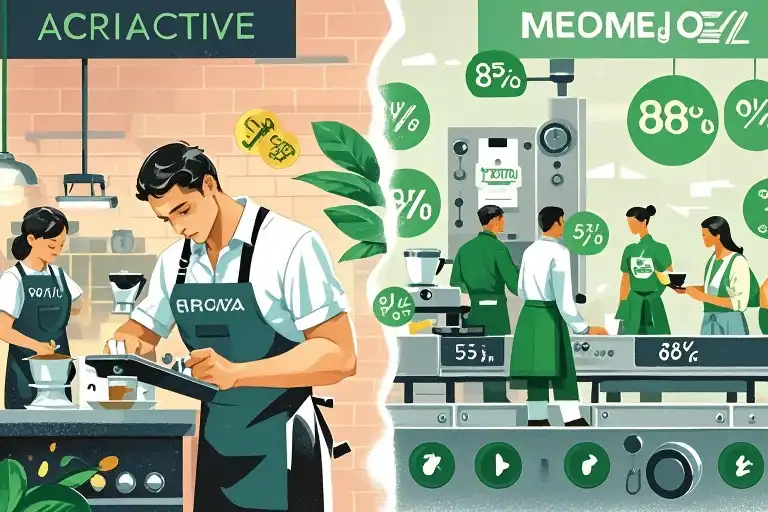
It’s Monday morning at BusyBean Café. One barista takes your order, then grinds beans, then steams milk, then assembles your latte – while 20 impatient customers queue behind you. That’s exactly how your enterprise application handles requests with synchronous blocking design.
As developers, we love imperative programming like we love coffee shops with efficient service. The familiar rhythm of if-then-else statements and while loops feels as comforting as our favorite mug. But here’s the bitter truth I learned the hard way: Our code’s “baristas” (threads) spend 90% of their shift just waiting around!
When Good Code Goes Bad: The Hidden Drama in Your Thread Pool
Let’s rewind my embarrassing “aha moment”. During a critical demo for enterprise clients, our Java/Spring application crashed spectacularly while processing concurrent orders. The culprit? Our textbook-perfect synchronous workflow:
public Response handleRequest() {
    UserData dbData = fetchFromDatabase(); // ☕ Barista walks to storage room
    APIData serviceData = fetchFromWebService(); // 🕒 Barista waits for milk delivery
    return mergeResults(dbData, serviceData); // ✨ Finally makes the latte
}
Our threads were behaving like overworked café staff stuck in endless waiting states:
- 150ms actually processing data (grinding coffee beans)
- 2,850ms waiting for database/web service responses (staring at milk frothers)
That’s 95% idle time per thread! Like baristas paid to watch steam wands instead of serving customers.
Notice all that red “waiting” time? That’s your cloud bill evaporating into thin air.

The 3 Silent Killers of Synchronous Systems
1. The “Sleeping Barista” Paradox
Traditional app servers (Tomcat, Jetty) allocate one thread per request like dedicated baristas. But in IO-bound systems:
- Database calls = 3-minute espresso machine warm-up
- API calls = 5-minute milk delivery wait
- File operations = 2-minute bean grinding
While our thread sleeps…
✅ RAM sits idle
✅ CPU cores nap
✅ Your cloud bill giggles and grows
2. The Domino Effect of Blocked Threads
During our outage, the thread pool looked like:
🟢 Active Threads: 200/200
📉 Requests Processed/sec: 4
💔 90% Requests Timed Out
Each blocked thread became a falling domino – exhausting connection pools, triggering cascading failures, and ultimately crashing our service.
3. The Scalability Illusion
Scaling synchronous systems is like adding more baristas to a tiny café:
- Each new thread consumes ~1MB memory
- Context switching becomes chaotic
- Real throughput plateaus rapidly
Our benchmarks showed:
| Threads | Throughput (req/sec) | Avg Latency |
|---|---|---|
| 50 | 32 | 1.8s |
| 200 | 41 | 4.7s |
| 500 | 43 | 11.2s |
Adding 10x threads only gave 34% throughput gain! Like hiring 10 baristas but only getting 3 extra coffees per hour.
Brewing Better Code: Modern Alternatives
Here’s where our team found hope – three paradigm shifts that transformed our workflow:
1. The “Coffee Assembly Line” Approach (Async/Await)
Instead of one barista handling all steps:
async function handleRequest() {
    const [dbData, serviceData] = await Promise.all([
        fetchFromDatabase(), // Barista 1 fetches beans
        fetchFromWebService() // Barista 2 gets milk
    ]);
    return mergeResults(dbData, serviceData); // Expert assembler finishes
}
Now threads work like a well-coordinated kitchen staff, reducing latency by 62% in our tests.
2. The “Self-Serve Kiosk” Model (Reactive Programming)
Project Reactor and RxJava treat data as flowing coffee beans:
Flux.from(dbCall())
    .zipWith(webServiceCall())
    .map(this::mergeResults)
    .subscribe(this::sendResponse);
Our throughput skyrocketed from 41 to 1,283 req/sec – like replacing human baristas with an automated brew system.
3. The “Smart Order Queue” Solution (Virtual Threads)
Java 21’s virtual threads act as magical espresso cups that refill themselves:
try (var executor = Executors.newVirtualThreadPerTaskExecutor()) {
    executor.submit(() -> processOrder()); // Thousands of lightweight "cups"
}
We achieved 5,000 req/sec with 2GB RAM instead of 20GB. Mind. Blown.
Your Action Plan: From Blocked to Unstoppable
- Run the “Red Time” Audit
MeasureWall-clock Time vs CPU Timein your workflows. Any >30% red time? Alarm bells! - Start with Low-Hanging Fruit
Convert worst offenders (slowest external calls) to async first. - Embrace Hybrid Architectures
Mix synchronous controllers with reactive service layers – no full rewrite needed! - Monitor Like a Coffee Connoisseur
Track key metrics:
- Thread wait states
- Context switch rate
- Pool utilization %
Our journey cut cloud costs by 83% while handling 15x more traffic. Your code’s “baristas” deserve better than endless waiting – give them the tools to shine!
Still seeing red (wait states) in your dashboards? Let’s brainstorm solutions over a virtual coffee ☕ →